My RTX PRO 4000 Blackwell SFF went from 35.04 to 58.53 tokens per second on Qwen3.8 27B. Getting there took a 120 W power limit and faster GDDR7. Finding out which changes paid off took 158 benchmark requests. The more useful discovery: Qwen3.6 35B A3B responded very differently.
The first time I raised the power limit, the screen said 106 W. Under load, the GPU still drew about 70 W.
The setting had changed. The machine hadn’t.
That turned out to be a useful introduction to the whole experiment. A bigger number in a control panel is easy to produce. More useful work is harder. And even when the tokens arrive faster, you still have to ask what you paid for them.
Eventually, I took one NVIDIA RTX PRO 4000 Blackwell SFF Edition from a 70 W runtime cap to 120 W and tuned its memory and core clocks. In the measured grid, Qwen3.8 27B’s best generation rate rose 67.05%. Qwen3.6 35B A3B’s rose 36.01%, on a different profile. The fastest input processing improved by roughly 52% and 62%, respectively.
Those are separate maxima, not four benefits delivered by one universal setting. The profile I selected came close to the Qwen3.8 27B generation record, but gave up some of the Qwen3.6 35B A3B generation record to process long inputs faster.
Two details belong next to the headline. The 70 W baseline ran on the same modified 120 W VBIOS image, with clock offsets set to zero. This is a comparison of runtime settings, not a clean factory-firmware-versus-modified-firmware test. And 120 W exceeds the standard 75 W PCIe slot budget on a card without an auxiliary power connector. The electrical consequences are real, even when the modification lives in memory.
The CSV exports let you check the benchmark arithmetic. The question behind it was simple: which setting actually bought the improvement?
One small GPU, two very different power curves
The full product name matters. An RTX A4000, an RTX 4000 SFF Ada, and an RTX PRO 4000 Blackwell SFF are different cards. This experiment concerns the last one: 24 GB of GDDR7, a 192-bit memory bus, 432 GB/s of specified bandwidth, and a factory 70 W maximum power specification. It used the original blower cooler with automatic fan control. NVIDIA’s specification establishes the product baseline.
I tested two existing local inference configurations:
- Qwen3.8-27B-iMatrix-NVFP4-256K-DFlash2: a Qwen3.8 27B model using NVFP4 and DFlash2 speculative decoding, generating 512 output tokens per request.
- Qwen3.6-35B-A3B-UD-Q4_K_S-256K: a mixture-of-experts model using Q4_K_S, without a speculative drafter in this series, generating 640 output tokens per request.
These are different models, quantizations, and decoding paths. The useful comparison is how each responds to changes relative to its own baseline. Their absolute token rates are not a model-quality ranking or a controlled comparison of dense and MoE architectures.
Before touching the clocks, I changed only the runtime power cap:
| Power cap | Qwen3.8 27B + DFlash2 | Qwen3.6 35B A3B |
|---|---|---|
| 70 W | 35.04 tok/s | 84.97 tok/s |
| 90 W | 47.05 tok/s | 93.63 tok/s |
| 106 W | 52.05 tok/s | 96.21 tok/s |
| 120 W | 54.18 tok/s | 96.43 tok/s |
| 70 to 120 W | +54.65% | +13.48% |
The Qwen3.8 27B configuration kept gaining. The Qwen3.6 35B A3B configuration was almost flat between 106 and 120 W. Giving it another 14 W of allowed power moved generation from 96.21 to 96.43 tok/s in this grid.
That was the first result worth sharing. The same GPU did not have one answer to “does more power help?” It had an answer for each workload. These measurements alone do not isolate whether architecture, quantization, speculative decoding, or their interaction caused the difference.
How 106 W on screen still meant 70 W under load
This did not start as an overclocking recipe. It started as an investigation of which limit was actually binding.
Reports about gpu-unlock prompted the search, but that was not the method used here. The experiment used a modified VBIOS image loaded into memory through patched NVIDIA open kernel modules. The approach came from Panchovix’s Linux VBIOS Vix Loader. The card’s EEPROM was not flashed. There was no soldering or shunt modification.
In the pinned loader patch, NV_VBIOS_OVERRIDE_MODE_KEY maps to RmLinuxVbiosOverride; the image is read through RmLinuxVbiosOverrideImage. The driver stages it in system memory and passes its address and size to the GSP (GPU System Processor) through vbiosOverrideArgs. That is the mechanism behind “loaded into memory.”
Even obtaining a reliable original image took work. In the experiment’s journal, the normal NVFlash save operation reported success but left a zero-byte file. A sysfs read returned only 4,096 bytes. Neither was the complete backup I wanted before proceeding.
During a maintenance window, the buffers read by NVFlash were captured through GDB before they were freed. Two independent reads produced identical 4 MiB EEPROM images, checked by SHA-256. That established the backup. It did not establish that a higher power setting was safe.
The next surprise was the apparently successful 106 W limit. Other power policies were still active. The visible ceiling was only one part of the constraint; a field decoded as board_fixed_rated_w and input policies also mattered.
In the final 120 W image, seven decoded fields changed:
power_max_wandboard_fixed_rated_w: 70 → 120 W.slot_power_max_wandslot_power_rated_w: 66 → 120 W.input_current_max_ma,input_current_rated_ma, andinput_current_policy7_limit_ma: 6,600 → 10,200 mA.
These are the parser’s names for GPU VBIOS policy fields. I did not modify the motherboard BIOS. The 66 W slot entries and 70 W total-board entries are separate limits; neither establishes the physical trip threshold of the motherboard’s protection circuitry.
The important fact is that this went beyond changing the number displayed in a panel. It also raised policies associated with power delivered through the slot.
Voltage fields were not raised; the decoded REL ceiling remained 850 mV. That does not mean the GPU ran at a measured 850 mV. This series did not have the core-voltage telemetry needed to make that claim.
The first FP32 test at 106 W reached the initial 90°C stop threshold and was interrupted. A subsequent run, using a 95°C stop threshold and automatic fan control, averaged 106 W and peaked at 90°C. It showed that the higher limit was taking effect. It was not a long-term reliability test.
The two jobs hidden inside one AI response
A local language model does at least two performance-relevant jobs before you get a complete answer:
Prefill processes the input: your prompt, conversation history, source files, or tool results. Decode generates the response. Both can be reported in tokens per second, but they measure different work.
A short question followed by a long answer gives generation plenty of influence over elapsed time. A long source file followed by a short patch can make input processing just as consequential. Prompt caching changes the balance again.
That distinction is why I recorded both phases instead of declaring a single “AI performance” score. I also recorded actual clocks, power telemetry, GPU temperature, applied offsets, response hashes, and available ECC counters.
The final grid contained 158 benchmark requests: 79 with ECC OFF and 79 with ECC ON, matched into corresponding configurations. It began with 18 configurations per model and ECC mode at 8,000 input tokens, then added selected 32,000-token points, repeat measurements, controls, and a separate power comparison.
It was a broad exploration of one card. It was not 158 repetitions of the headline result. Individual aggregate cells contain only 1–3 requests.
Faster GDDR7 helped. Then one model stopped benefiting
At 120 W, I tested memory frequency increases of roughly 10%, 20%, and 33.3%, with the core offset held at zero.
The helper uses nvmlDeviceGetClockOffsets() / nvmlDeviceSetClockOffsets() for both P0 and P2 performance states, targeting the Blackwell by UUID. It checks the allowed range and reads back clockOffsetMHz after each write. Graphics and memory are separate NVML domains: NVML_CLOCK_GRAPHICS = 0 and NVML_CLOCK_MEM = 2.
For Qwen3.6 35B A3B, generation rose from 96.43 tok/s without memory OC to 109.94 at +20%, then 115.56 at +33.3%. That last step was still useful. Compared with the 70 W baseline, the highest measured Qwen3.6 35B A3B generation result was +36.01%.
Qwen3.8 27B behaved differently. It rose from 54.18 to 57.70 tok/s at +20% memory, then slipped to 56.91 at +33.3%. The higher memory setting did not win. The same direction appeared in both ECC modes, although the difference is small and needs more repetitions before assigning it much precision.
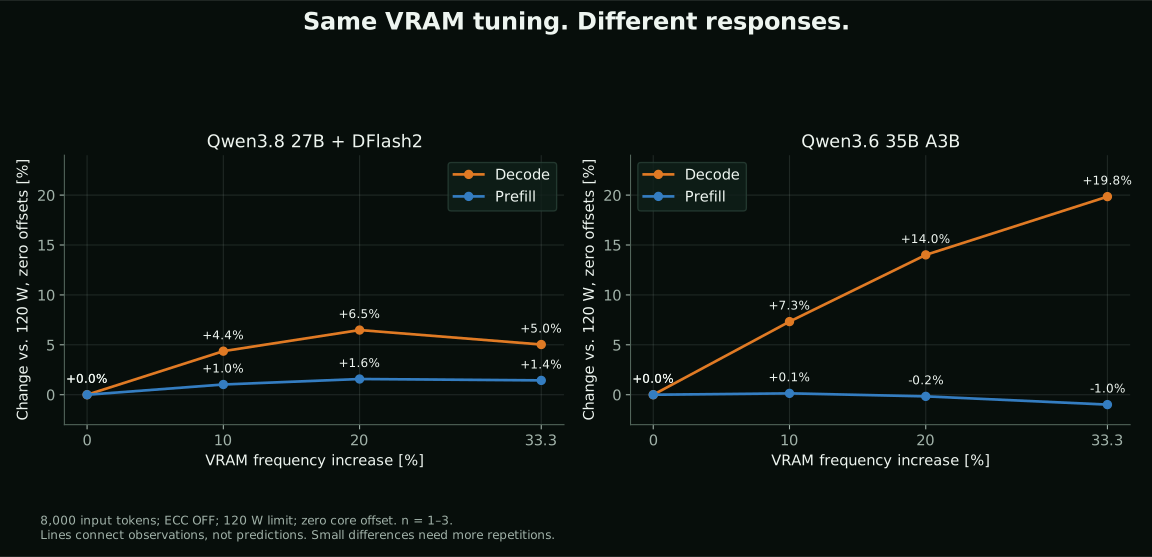
The telemetry provided a possible explanation: the higher memory setting came with a lower actual SM (Streaming Multiprocessor) clock during generation. That is consistent with memory and compute competing within a shared power budget. It is not proof. Memory power was not measured separately, and the experiment did not isolate the mechanism.
For the operator, the observed result is already useful: the highest available memory setting was not automatically the best setting for both models.
On this 192-bit bus, 18 Gb/s per pin corresponds to the specified 432 GB/s. A 20% increase corresponds to 21.6 Gb/s and a theoretical 518.4 GB/s. A 33.3% increase corresponds to 24 Gb/s and 576 GB/s.
A separate memory-copy test rose from approximately 377 to 503 GB/s of combined read/write throughput. That is a measurement from a particular copy test, not a replacement for the nominal bus specification and not an LLM generation rate.
I did not test 28 Gb/s. The often tempting 672 GB/s calculation for that setting remains hypothetical. “GDDR7” does not establish the memory vendor, speed bin, timings, or electrical margin of this particular card.
The profile I chose was not the generation record
Adding a core offset helped input processing more clearly than it helped the final fraction of generation throughput.
The best measured Qwen3.8 27B generation result was 58.53 tok/s, at 120 W, memory +20%, and core +180 MHz. Raising the core offset to +360 MHz produced 58.49 tok/s: effectively a tie at the precision this experiment can support. Prefill, however, rose from 1,452.66 to 1,492.34 tok/s.
The +360 MHz profile also produced 2,336.75 tok/s prefill and 112.57 tok/s generation on Qwen3.6 35B A3B. Its generation was below the 115.56 tok/s memory-only record, but its input processing was faster.
Here is the selected profile against each model’s own baseline:
| Model / phase | 70 W baseline | Selected profile | Change |
|---|---|---|---|
| Qwen3.8 27B prefill | 981.08 tok/s | 1,492.34 tok/s | +52.11% |
| Qwen3.8 27B generation | 35.04 tok/s | 58.49 tok/s | +66.93% |
| Qwen3.6 35B A3B prefill | 1,441.07 tok/s | 2,336.75 tok/s | +62.15% |
| Qwen3.6 35B A3B generation | 84.97 tok/s | 112.57 tok/s | +32.48% |
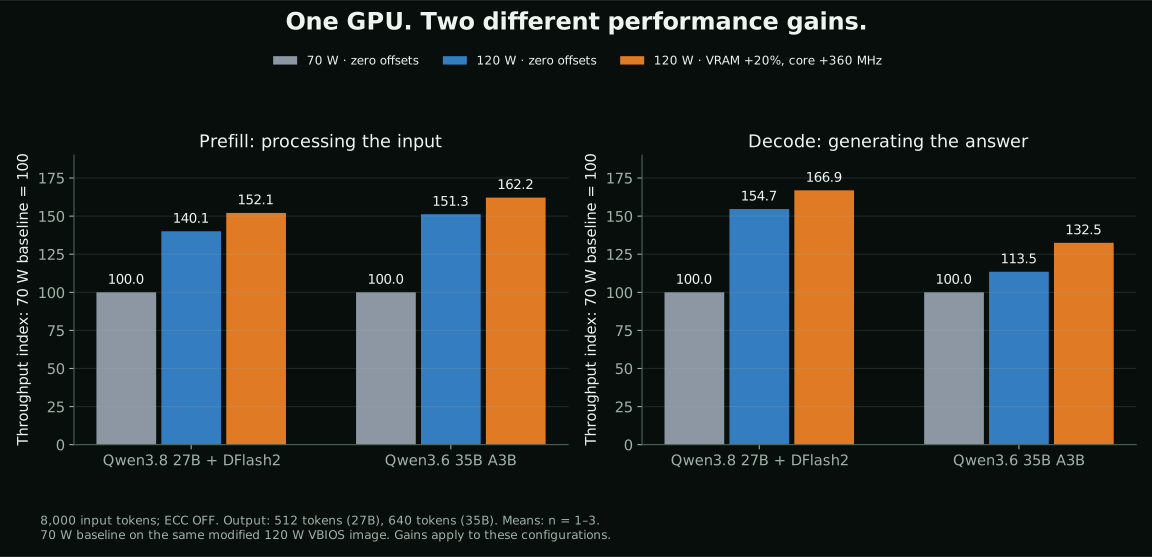
The 70 W baselines contain one request for Qwen3.8 27B and two for Qwen3.6 35B A3B; the selected profile contains two requests per model. I report two decimal places to make the arithmetic traceable, not to claim that level of experimental certainty.
For a long-input workload, the trade-off becomes easier to see. At 32,000 input tokens, the balanced Qwen3.6 35B A3B profile delivered 2,121.56 tok/s prefill and 82.07 tok/s generation. The memory +33.3%, core-zero profile delivered 1,972.45 and 82.28, respectively.
Almost identical generation. Noticeably different input processing.
A simple estimate is:
response time ≈ uncached input tokens / prefill rate
              + output tokens / generation rate
For 32,000 input tokens and 500 output tokens, that gives 21.18 seconds for the balanced profile versus 22.30 seconds for the memory-only profile: about 5% less time.
That is a calculation from measured rates, with output length extrapolated from the 640-token test. It is not a measured 500-token end-to-end response. It excludes model loading, network overhead, tools, cache effects, and application scheduling. Its purpose is to show why the decode winner need not be the response-time winner.
The Qwen3.8 27B percentage needs the same arithmetic discipline. 67% more tokens per second means about 40% less time for a fixed amount of generation, because time scales with the reciprocal of throughput. It does not mean a 67% shorter complete request.
The last 14 watts bought speed at a worse rate
The broad grid was useful for finding candidates. For a more controlled comparison of 106 versus 120 W, I used an ABBA sequence: 106 → 120 → 120 → 106 W, inside one loaded instance of each model.
Memory stayed at +20%, the core offset stayed at zero, and each power/context combination had two requests. Placing 106 W at both ends balances a roughly linear drift over the sequence; it does not remove every source of variance.
The benchmark computes decode_tps_per_w for each request as decode_tps / decode_power["mean_w"]. Phase power comes from integrating the sampled telemetry with linear interpolation, splitting at the first streamed content. The aggregate averages those request-level ratios. Dividing tokens per second by the configured 120 would answer a different question.
For ECC OFF, the results were:
| Model / input | Generation | Prefill | Generation per watt |
|---|---|---|---|
| Qwen3.8 27B / 8,000 | +8.55% | +4.53% | −2.47% |
| Qwen3.8 27B / 32,000 | +8.63% | +4.48% | −3.53% |
| Qwen3.6 35B A3B / 8,000 | +2.16% | +5.16% | −6.36% |
| Qwen3.6 35B A3B / 32,000 | +2.98% | +5.48% | −7.30% |
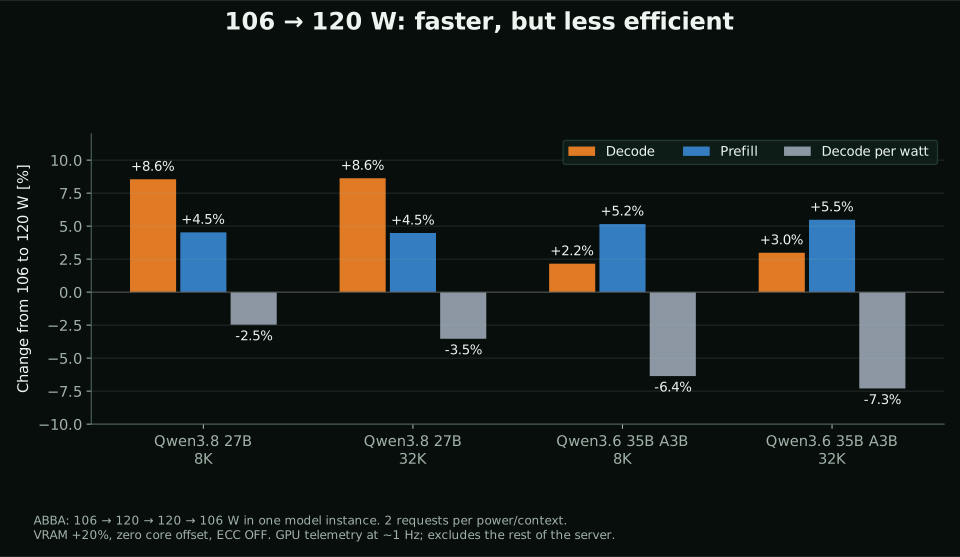
There is a legitimate reason to choose 120 W: the answer arrives sooner. There is also a legitimate reason to consider 106 W: for Qwen3.6 35B A3B generation in this comparison, the last increment bought only 2–3% more throughput while reducing throughput per watt.
Neither setting is an electrical safety recommendation. Both exceed the card’s factory rating, and 106 W still exceeds the standard slot budget.
The distinction also matters to my broader interest in Joule Wars: throughput, GPU efficiency, and energy per completed task are different quantities. This dataset measures the first and estimates phase-level GPU efficiency. Without wall power and task-level measurements, it cannot settle the third.
What ECC did, and did not, tell me
Every tested configuration had a corresponding ECC ON/OFF condition. Before a window, the harness checks both ecc.mode.current and ecc.mode.pending: an accepted change can still be waiting to take effect. In this experiment, a GPU reset before DRM/fbdev initialization applied the change without a host reboot; reloading modules alone had left the modes different.
In the recorded ECC ON windows, corrected and uncorrected DRAM error counters stayed at zero, in both the volatile and aggregate counters. With ECC OFF, those counters were unavailable. Unavailable is not zero.
The absence of reported errors in these windows is useful evidence about these runs. It does not establish a long-term safe memory frequency or exclude every kind of silent error.
Nor does this experiment cleanly measure the performance cost of ECC. Responses differed after reloading between ECC sessions. With speculative decoding, a different generated sequence can change the drafter’s acceptance behavior and the work needed per delivered token.
Within a given session and context, response hashes matched. Across ECC sessions, they did not. Subtracting the two sessions’ token rates and calling the difference “ECC overhead” would mix multiple effects.
This is why the main comparisons stay within the ECC OFF condition, while the matched ECC ON runs serve as additional observations. Readers interested in the decoding mechanism can find the background in my earlier DFlash article.
A few other apparently promising results also failed to justify their first interpretation. A roughly 2% core-clock gain in a synthetic BF16 test was matched by drift in the ending zero-offset control. An undervolting pilot failed to hold a comparable actual clock. Neither became a claimed win.
The broad model grid’s end controls also drifted: generation changed by approximately −1.11% to +0.01%, and prefill by roughly −0.96% to −0.55%. That is another reason to avoid declaring a winner over a few hundredths of a token per second.
Why I stopped at 120 W: the GPU sensor cannot see the connector
The component I am most concerned about is not necessarily the silicon.
This card takes its power from the PCIe slot. Raising a software policy does not add an auxiliary connector, improve a contact, or increase the motherboard’s current-handling capability. NVIDIA’s PCIe slot power-rail guidance describes the standard 75 W slot class; this experiment goes beyond it.
A deliberately simplified calculation shows the scale. If all power came from 12 V, 70 W would imply about 5.8 A, while 120 W would imply 10 A. That is roughly 71% more current. The slot also supplies 3.3 V, and I did not measure the split between rails or individual contacts, so these are illustrative equivalents, not measured rail currents.
For a fixed resistance and unchanged current distribution, resistive heating follows I²R. The ratio (120 / 70)² is about 2.94. In that simplified model, losses in the same current path nearly triple.
That does not mean the connector temperature triples. Temperature depends on heat transfer, and the actual currents and resistances are unknown. It does mean that a reassuring GPU temperature cannot answer the connector question.
The highest recorded GPU temperature in the 158-request grid was 92°C. VRAM, VRM, and PCIe contact temperatures were not measured directly. The profile’s controller requests a return to 70 W, clears overclocks and clock locks, and stays in a restricted state at a GPU temperature of at least 95°C. In the controller, that outcome is thermal_trip_latched: it does not automatically resume 120 W when the GPU cools down. That is a response threshold, not a declaration that every component is safe below it. A 70 W cap on the modified image also does not restore the image’s original input-protection policies.
At the close of the experiment, inspecting the slot and card contacts for discoloration or deformation was still planned. Even a clean visual inspection would not replace temperature measurements under load or establish the absence of degradation.
The settings worked during the observed runs. Months of operation remain a different question.
What I kept, and what I would measure next
I selected 120 W, memory +20%, core +360 MHz, ECC OFF, and automatic fan control for the tested setup. It balanced input processing and generation across the two models, instead of maximizing a single column in the table.
The profile was saved and its live activation checked after services returned. A complete boot with that new default remained unverified at the experiment’s cutoff on 25 October 2026. This article records that cutoff, not a fresh claim about the machine’s current state.
There are straightforward next measurements: more repetitions of the shortlisted profiles, a factory-firmware baseline, wall power, direct thermal observations of the power path, and actual application-level response times with realistic prompt caching. Testing other workloads would be a separate experiment; these Qwen results say nothing yet about speech recognition, voice generation, or video inference.
The result I will remember is the almost-flat Qwen3.6 35B A3B power curve. At that point, the most obvious intervention had largely stopped buying the thing I wanted. Faster memory changed the result. A different input length changed which profile I preferred.
The useful overclock is the one that shortens your workload. You cannot choose it from the GPU’s biggest number.
The 67% generation gain on Qwen3.8 27B is real within the stated comparison. So is 115.56 tok/s on Qwen3.6 35B A3B. Neither is a universal multiplier for everything the GPU does.
What the measurements support
- Qwen3.8 27B generation: 35.04 → 58.53 tok/s at the best observed profile, about +67%; the selected profile delivered 58.49 tok/s.
- Qwen3.6 35B A3B generation: 84.97 → 115.56 tok/s at a different profile, about +36%; the selected profile delivered 112.57 tok/s.
- More power and faster memory solve different constraints. Their value depends on the model, runtime, and balance of input processing to generation.
- The final 106 → 120 W step reduced generation throughput per watt in every reported ECC OFF ABBA comparison.
- This is one-card exploratory evidence. It does not certify slot safety, long-term stability, model quality, or a universal speedup.
Data, method, and the limits of reproduction
The measurements were collected on 24–25 October 2026, on one RTX PRO 4000 Blackwell SFF with its stock cooler.
Server: AMD Ryzen 7 7700; ASRock B650M Pro RS (micro-ATX); 32 GB DDR5-6000 CL30 (2 × 16 GB); Lexar NM790 2 TB NVMe SSD. Second GPU: NVIDIA RTX 2000 Ada, 16 GB, no OC. Software: Debian 13.7, kernel 6.12.38+deb13-amd64, NVIDIA Open 615.71.10, and an existing custom inference build.
Inputs contained exactly 8,000 or 32,000 tokens, not 8,192 or 32,768. The protocol used uncached inputs. Output counts were 512 for Qwen3.8 27B and 640 for Qwen3.6 35B A3B. The main comparisons use ECC OFF and zero locked-clock settings; core values are offsets, not guaranteed operating clocks. Memory offsets of 0, 1,800, 3,600, and 6,000 in the recorded NVML setting correspond to the approximate 0%, 10%, 20%, and 33.3% settings discussed here. These API values are not portable slider settings for other overclocking tools.
The public export contains 158 request rows and 102 aggregate rows. Power sampling was approximately 1 Hz, with the phase boundary assigned at the first streamed content. Short phases therefore contain few power samples. Occasional samples could exceed the nominal cap. None of these figures is a measurement of whole-server power.
Selecting the best points from the same exploratory grid can favor noise. No confidence interval is claimed. Response-hash agreement is a bounded consistency check, not a broad quality evaluation. The package lets you audit the reported arithmetic; it does not contain the full original operational logs, model artifacts, prompts, or a complete environment needed to independently reproduce the GPU experiment.
Download the 158 request-level measurements, full aggregation, selected 8K results, ABBA power comparison, control drift, and response-time estimates.